Floodzilla provides critical flood information to Snoqualmie Valley residents
Published 11:00 am Friday, October 10, 2025

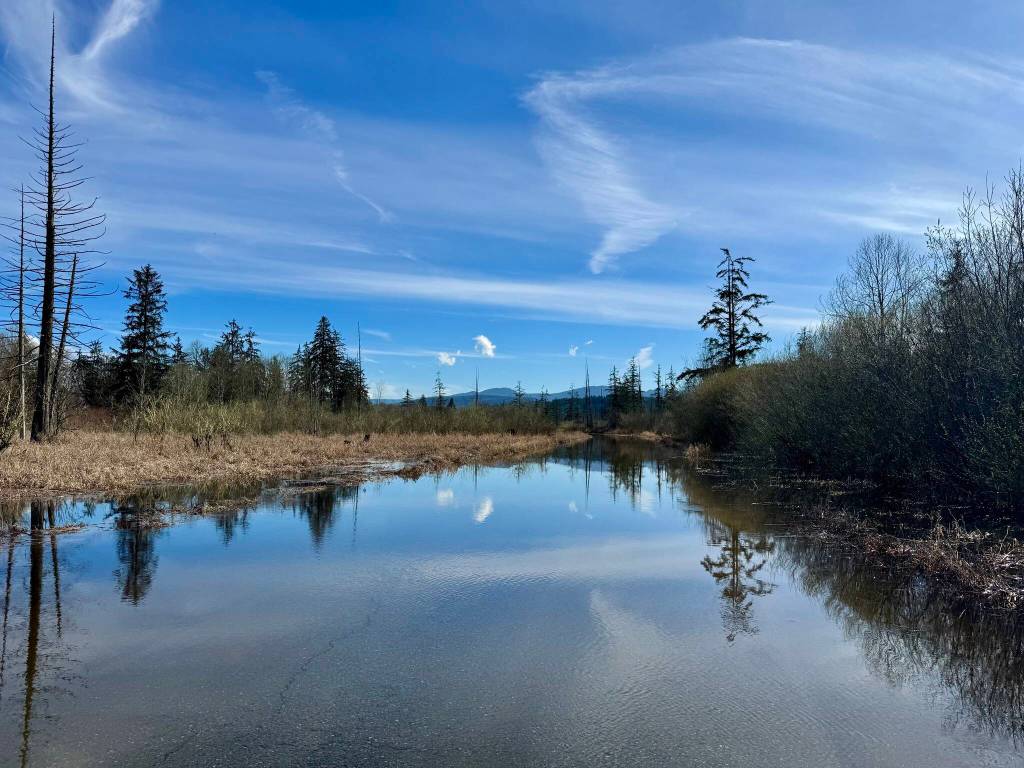


The Snoqualmie River is the lifeblood of the Snoqualmie Valley — for better or worse — and that’s never more apparent than during flood season.
Starting in October, the Snoqualmie Valley Record is producing four stories that cover how Valley residents manage flood season, from coexistence to mitigation to prevention. We will look at flood experiences on individual, community and regional levels.
In the end, we hope to shine a light on what it really means to live riverside.
–
Two weeks after Regina Fletcher started as Floodzilla’s field scientist in 2022, an atmospheric river hit the Snoqualmie Valley.
Typically, flood season in the Valley is defined as November through April, but that definition has been tested in recent years. In May 2022, Floodzilla had just taken its gauges down for the summer when Fletcher and her predecessor had to spend a night putting them back up.
Since then, Fletcher says, she’s wary of June flooding.
“Every year I have kept an eye on June,” she said. “Around June 10, there seems to be some sort of atmospheric river.”
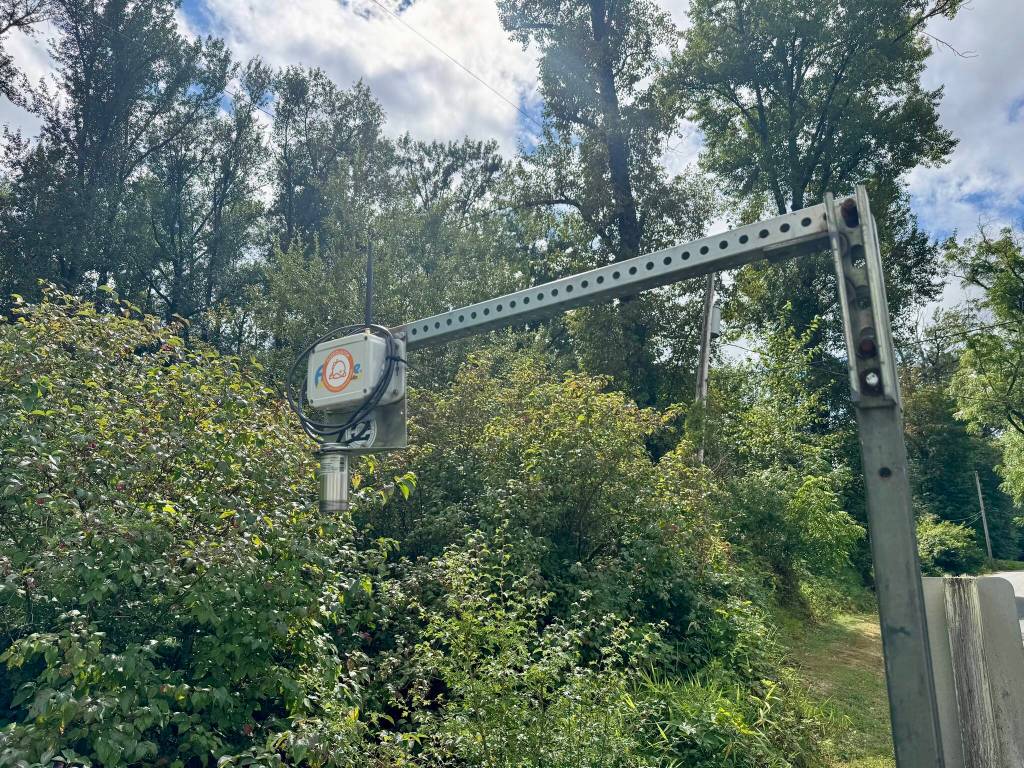
Floodzilla is a network of Snoqualmie River gauges that monitor water levels for the lower valley — from the bottom of Snoqualmie Falls through Duvall. It is a free product of the Snoqualmie Valley Preservation Alliance (SVPA), a nonprofit based in Carnation that joins local stakeholders to protect the Valley’s land and agricultural viability.
Floodzilla’s information can be found at floodzilla.com, where users can sign up for email alerts for some or all gauges. The website includes 14 of Floodzilla’s own gauges, as well as data from U.S. Geological Survey (USGS) gauges in the Valley. Fletcher said the goal was to cover each of the lower valley’s 32 river miles, filling in gaps between USGS gauges.
But Floodzilla isn’t just about providing alerts. SVPA’s Executive Director Lauren Silver-Turner said it also provides historical data going back several years. This data allows SVPA to analyze flood information in more detail than what USGS gauges offer, she said.
And the data is showing some clear trends.
“Everybody that lives and plays and works here loves the fact that the river is like the lifeblood of the Valley,” Silver-Turner said. “But, over time, we’re seeing these out-of-the-traditional-flood-season events.”
Floodzilla has become a critical tool for several reasons, including that it can tell those who farm the land when the water is going to hit them, affecting their lives and livelihoods.
“Just knowing how to plan and how much time you have to get your equipment and your animals to high ground and move your family to where they need to be,” Silver-Turner said. “And so that you can get to work in the city if you’re commuting and planning those routes.”
How Floodzilla works
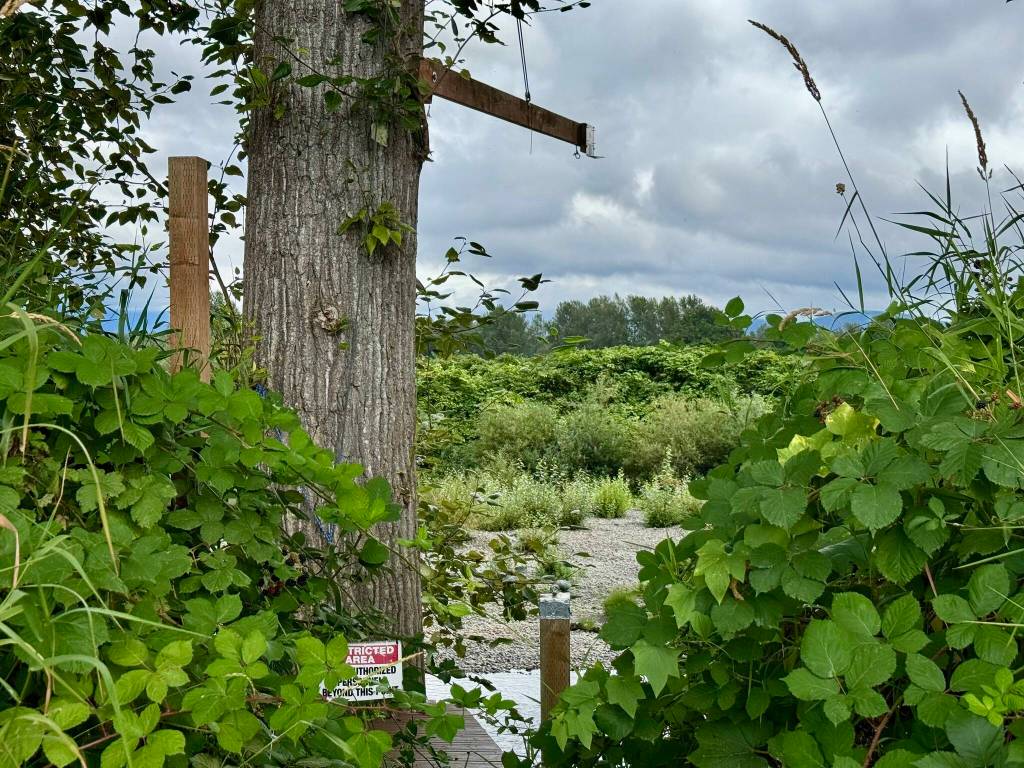
Floodzilla’s gauges are typically offline from May to September, unless Floodzilla receives requests for certain gauges to be left on for research or other purposes. When online, the gauges are set to receive new data and update the website every 15 minutes.
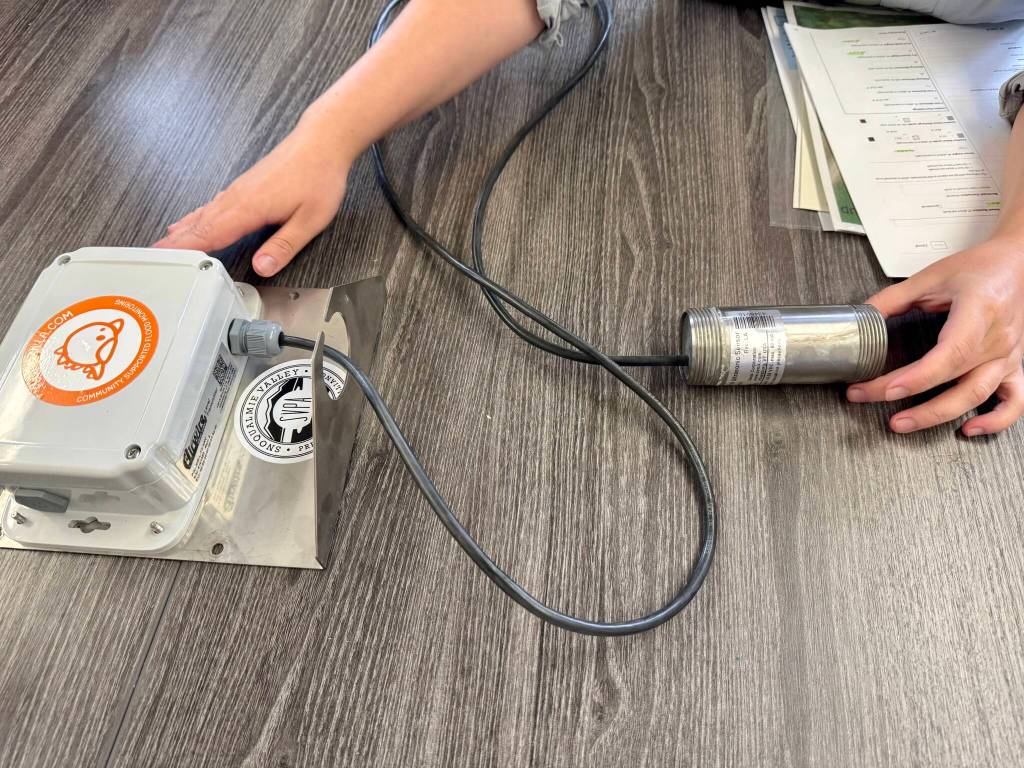
The gauges have a battery and a transmitter inside them, working off of a radio signal to send data to the closest gateway it can find. Gateways are scattered throughout the Valley, mostly on private property. Gateways send the data to a networker server, which then loads the data onto the website.
“There’s a lot of talking points where they have to send back and forth these data packets,” Silver-Turner said. “The gauge is transmitting the data, but then the gauge also has to be reminded, who am I?”
Gateways run on electricity, which can be tricky in a valley that is prone to power outages.
If updates are not coming in every 15 minutes, Fletcher will research if there have been power outages and for which gateways.
Fletcher is currently working to put out new gauges, which are smaller and have a 10-year battery life. And she is always working to improve the connection for the gauges, which in a natural environment, can be impacted by things like wind, debris or greenery.
“A lot of it is trial and error, especially in an environment where all this stuff is being subjected to the elements, and there’s a lot of things that can kind of throw wrenches in the system,” Silver-Turner said. “Enhancing the functionality and the connections and stuff is something that we’re always working on.”
Another recent and efficient addition to Floodzilla’s work has been real-time kinematic (RTK) surveying, which uses satellite-based technology to measure elevation of the gauge sites.
“We’ve been using this new tool where it’s satellite-based, and you can stand there and it will tell you down to the inch … what that [elevation] level is,” Fletcher said.
Emergency management teams generally recommend not driving through six inches of water or more, Fletcher said, and any amount of water could be unsafe.
“It can be a matter of just inches between the road being dry or passable and it being covered in water,” Silver-Turner said. “So [we’re] making sure that the measurements between the bottom of the sensor to the ground — or the dry level or the normal level — is accurate.”
Fletcher’s daily work starts with reading the data for any unusual numbers that may indicate a needed site check. The goal, she said, is to always have someone watching the data during waking hours.
Floodzilla is useful because it is able to zoom in on a specific area, as opposed to King County and USGS that have a large service area, Silver-Turner said.
“When you span a really wide service area, you can’t get to the level of detail and scope that we have kind of narrowed in on to provide a lot more information for this smaller area that is significantly impacted,” she said.
She added: “We go above and beyond what’s predicted, we’re showing people what is actually the water elevation that’s happening right down your street.”
Data vs. lived experience
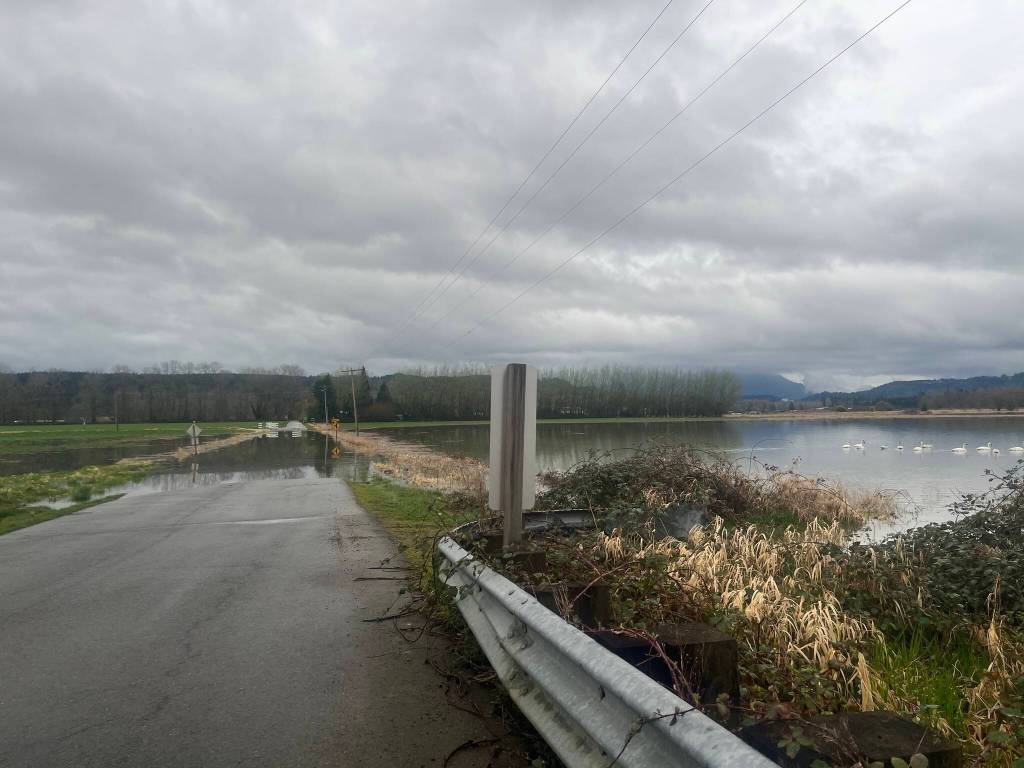
As the elevation varies throughout the Snoqualmie Valley, so do the flood conditions. Consequently, not everyone believes that flooding is, in fact, worsening, Silver-Turner said.
The last year in particular was interesting, Fletcher said, as there were several minor floods as opposed to one or more large ones. While busy commuter routes — such as NE 124th Street outside Duvall — did not close, many secondary roads went underwater, unbeknownst to some.
“It’s been echoed many a time, people haven’t felt that the flooding is worsening,” Silver-Turner said. “Being able to point to that data and to that kind of information helps for future planning, for mitigation and prevention.”
Based on the “Snoqualmie River at Carnation” gauge, Silver-Turner said, severe flooding is defined as an elevation greater than 54 feet or 38,000 cubic feet per second. This type of flooding affects the Valley every two to five years.
“Minor flooding, which is 54 feet, and moderate flooding, which is 56 feet … occurs every winter, impacting residents, farmers, businesses, visitors,” she said.
In addition to people not believing flooding is worsening, many locals feel as though they have experienced worse flooding than what is being documented, Silver-Turner said.
“A lot of people feel as if [they’ve] seen what would be considered a 100-year flood, even though it may not have reached the cubic feet per second to dictate that,” she said. “Because of the variation in the landscape, there’s not a perfect conversion from the cubic feet per second to what you actually see on the ground.”
Floodzilla is at the whims of greatly varying conditions, including backwater flooding. The lower valley has several tributaries that feed into the river. If those tributaries get backed up, it can cause flooding upstream.
“Sometimes the flooding is going backwards, so there’s a lot of very unique situations,” Silver-Turner said. “That’s largely Regina’s job, is working with landowners and the community to understand where those spots are that are most needed to understand the flooding dynamics.”
Silver-Turner said Floodzilla — generally a visual tool — is working to add visuals to its website to make flood information all the more accessible.
“We want to make this data as accessible and easy to understand as possible,” she said. “New people that haven’t experienced living in a place that has this kind of flooding can look and say, ‘Hey, oh gosh, my house is right here.’ And like, this is what could happen at this size flood that they’re predicting.”
By the people, for the people
Floodzilla was started in the early 2000s as a passion project of Geary Eppley, a local software engineer who had moved to Carnation and ended up with 5 feet of water in his garage.
By 2009, Floodzilla was a valued community asset and Eppley was a bit of a local celebrity. Eppley started the website for himself, but his list of interested neighbors continued to grow.
Around that time, Eppley banded together with a group of locals who were against Puget Sound Energy’s plans to lower the Snoqualmie Falls coffer-dam in order to mitigate upper valley flooding — which it did in the 2010s.
“That’s kind of when everybody came together as a collective to address the potential downstream impacts of what was happening there, with regards to flooding,” Silver-Turner said.
In 2014, that group of locals officially became SVPA, a 501(c)(3), “to make sure that the voices of the Valley are heard, with regards to projects and policies and investments,” Silver-Turner said.
Floodzilla also became a product of SVPA, though it has remained as accessible to users as it was when it was a passion project.
“We certainly don’t want to charge people to use Floodzilla,” Silver-Turner said. “We always want it to be a free resource because that’s what it should be.”
Over the years, Floodzilla has become a valuable resource for locals, creating a sort of symbiotic relationship between users and the Floodzilla team.
“We’ve built some really good relationships with these land managers and farmers who provide invaluable information,” Fletcher said. “That’s our strength, is that we can really pinpoint where the problems are and get that data based on that.”
Today, Fletcher is Floodzilla’s only full-time member, but she receives support from Megan Tarmichael, a floodplain field technician who splits her time between Floodzilla and SVPA’s BeaverWise program.
The team also receives help from the Floodzilla gauge steward volunteers — currently four people — who help maintain interference at the gauge sites so Fletcher doesn’t have to frequently drive the 32 river miles.
On the website side, Floodzilla has local software developers who donate time to work on the backend.
Fletcher and Tarmichael’s work is 100% covered by a King County Flood Control District grant, Silver-Turner said, but the coverage ends there. In the future, she said, SVPA may have to rely more heavily on community donations in order to keep Floodzilla free.
The community is heavily invested in Floodzilla, helping not only to pick the gauge sites, but sometimes helping build the sites as well. This can be empowering for community members, Silver-Turner said, and sets Floodzilla apart from other similar services.
Floodzilla, she said, is ultimately about those who use it.
“That’s why we’re here,” she said. “To provide this critical tool and resource, as one part of what we do, but being responsive to community is our goal.”