Data shows Snoqualmie is one of state’s fastest growing cities
Published 1:30 am Monday, July 26, 2021


Data released at the end of June shows that Washington’s population has continued to rise in the last year, with Snoqualmie as one of the state’s fastest growing cities.
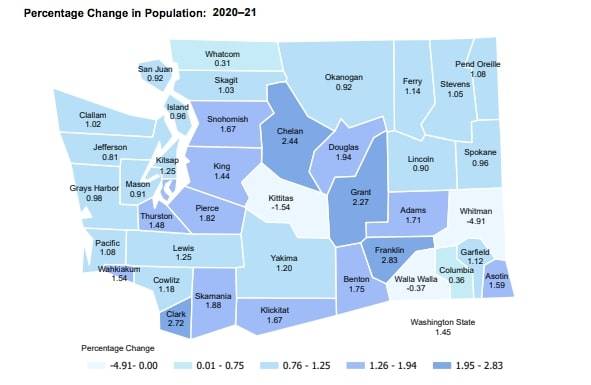
The data, provided by the Washington state Office of Financial Management, tracked estimated population growth for the state between 2020 and April 1, 2021.
According to the data, Snoqualmie had the 13th highest per capita growth rate in the state last year, and the highest among King County cities, at 5.04%. Ridgefield had the highest rate at 18.32%, followed by Black Diamond at 15.08% and Winlock at 8.93%.
Between 2010 and 2021, Snoqualmie’s population rose by 3,700 residents, including about 700 between 2020 and 2021. North Bend has grown by 1,969 residents in the last decade, including 245 in the last year.
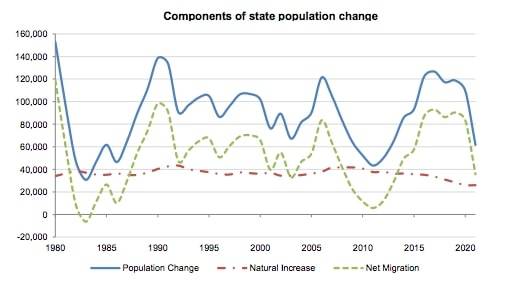
The office estimates that the state population is at 7,766,925 residents as of April 1, an increase of roughly 110,700 from this time last year, for a Growth rate of about 1.45%.
The majority of this growth — about 60% — is due to migration, with net migration estimated at 37,100 residents between 2020 and 2021. The other 40% of growth comes from births. Both migration and birth rates were down from last year, likely due to the pandemic.
The state population has grown by just over a million people in the last decade, with an average increase of roughly 94,000 people a year. This is up from the 83,000 average between 2000-2010
Over the last decade, King County has had the highest average growth rate, with an average increase of 35,000 people a year. Between 2000-2010, King County’s average increase was 19,400 people a year.
In 2021, King County was responsible for roughly 30% of the state’s growth, with a population increase of 1.44% or 32,500 residents.
Statewide 46,700 housing units were built this year, which is 2,350 fewer than last year, but higher than the decade average of 34,700 since 2010. King County had the most housing units built last year at 15,250. King County is also responsible for 36% of constructed housing units since 2010.